
Designed for Managers, Not Data Scientists
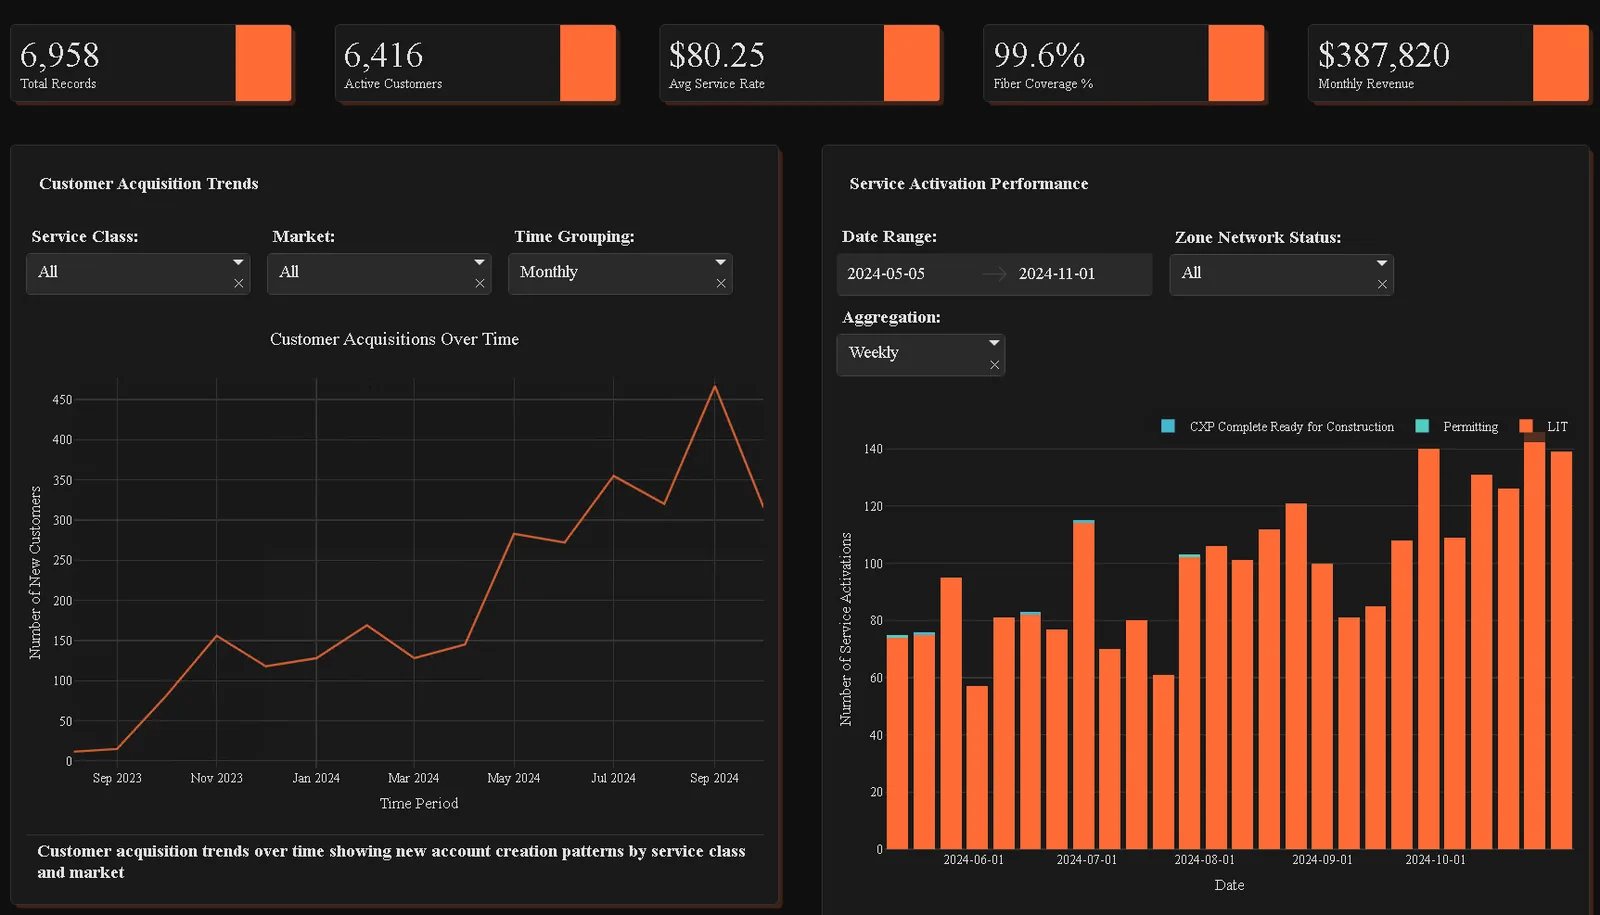
Most of the questions an operator asks us do not have a chart waiting for them. Somebody has a billing export, a spreadsheet of installs, a pole dataset, the question is a reasonable one, and the honest answer used to be that we would take it to a developer and come back in a week or two.
The delay is not really the cost. When an answer takes two weeks, people stop asking, and the questions that still get asked are the ones somebody already built a report for. The person who wants to look at something new is usually the one furthest from the tools.
We Got an Early Look at Something That Closes It
Early this year we were given access to a new tool, well before it was generally available, that does what we had been waiting for. You hand it a data file and it builds you a working analytics application. Not a chart, and not a chatbot answer, but a real application with filters, KPI tiles, and charts you can share.
Over the course of the year we pointed it at two very different datasets. A customer export out of an OSS/BSS, the file every operator already has, came back as service analytics covering package mix, activation trends, and churn. A utility pole dataset, messier and a lot more visual, became a pole analysis dashboard in under fifteen minutes. Same tool, no setup.
How It Works
- Upload the file. A .csv is enough. No connector to configure, no schema to define.
- Context is optional. You can tell it “export from our billing system, we care about packages, activation time, and churn,” but you do not have to. It reads your column names and a sample of your rows and works out what the dataset is on its own.
- Wait about ninety seconds. You get a first pass with the KPIs it thinks matter, filters across your dimensions, and a handful of charts.
- Then keep talking to it. Add a view, break the churn chart out by market, switch to a dark theme, move that table above the map.
- Publish it. One click gives you a link you can hand to your team or protect with a password.
That inference step is what surprised us most. The amount of context it derives on its own is remarkable, and the first pass is usually close enough to work from.
Why This One Is Different
- The output is code. It generates a real Python application, so a mock-up we put together with a client on a call can be edited, hardened, and deployed for production. Most tools hand you something you rebuild from scratch the moment you get serious.
- Your data stays where it is. The model only sees your column names and a few sample rows, never the whole file, and its job is writing chart code rather than calculating your numbers. For anyone handling subscriber records, that matters.
- It closes the gap we opened with. The manager with the question and the person who can answer it are finally the same person.
At Broadband Insights, We Call It Rapid Dash
We packaged it for our corner of the world and named it Rapid Dash. Smaller and rural providers do not have a data science team, and their questions are broadband questions: homes passed against cost, installs against trouble tickets, take rate by market.
It also does not have to be a file exported by hand. For operators we already run pipelines for, we can generate the export, so the dashboard starts from data that is already aggregated, reconciled, and quality checked.
None of this replaces our enterprise platform, where a dashboard is a scoped build measured in weeks. Rapid Dash is for the question you want answered this afternoon, and for mocking up something you may decide to build properly later.
Rapid Dash starts as low as $300 a month, with unlimited .csv uploads and unlimited viewers. It is priced to be a decision somebody can make without a committee.
If you have an export sitting on your laptop that you have been meaning to do something with, we would love to show you what comes back. Have a look at Rapid Dash, or reach out and we will run it against your own data!