
Why Your Metrics Never Live in One Place
Ask an operator how much footage went in the ground last week and someone can tell you. Ask how many homes that passed and it is a different person. Ask what take rate looks like in the neighborhoods lit last year and it is a third.
None of them is wrong, and none of them can see the other two. The marketing lead can tell you exactly how a fiberhood is filling up and has no idea how much conduit went in the ground to get there. Somebody stitches all three together in a spreadsheet on Monday morning before the leadership call.
That gap is what we went to Nashville to talk about. At Fiber Connect 2025, the Fiber Broadband Association’s annual conference, we presented “From Permits to Penetration: Unlocking the Power of Your Data” in the Fiber Theater. Two use cases from opposite ends of a build, one thread running through both.
Why One Platform Never Happens
There are more of these than three. Network connectivity sits in the FMS, billing in the BSS, sales in the CRM, financials in accounting. Each is good at the job it was bought for, and each holds a number the business runs on.
The temptation, roughly once a year, is to go looking for the one platform that will finally hold all of them. That will never happen. Systems get bought, replaced, and inherited through acquisition, and no vendor is best at both moving a permit through a county office and telling you how a fiberhood is filling up.
Consolidating the data is the achievable version of that goal, and a different project than consolidating the software. It does not finish the job on its own either: even once the data sits together, making meaning of it takes time and expertise.
From Permits: Where the Schedule Actually Slips
Permits are the clearest case, because the cost of not seeing them is so specific. Take a construction package carrying five permits: three approved, two still sitting as submitted.
On a status report that package reads as sixty percent permitted, which sounds like progress. On the ground it reads as zero, because the crew cannot start until the last one clears. The useful view is not the percentage, it is which two, with which agency, filed on what date.
At BBI, we build permit tracking as paired map and spreadsheet views, so a package sits next to the backhaul, middle mile, and distribution segments it unblocks. Long lead permits, the railroad crossings and state highway ROW filed months ahead, get their own view, because those quietly set the schedule.
That means faster planning and a lower cost per passing, the same idea as avoiding stranded assets: duct in the ground that cannot serve anyone yet is expensive in the way an unfiled permit is.
To Penetration: Take Rate on a Common Clock
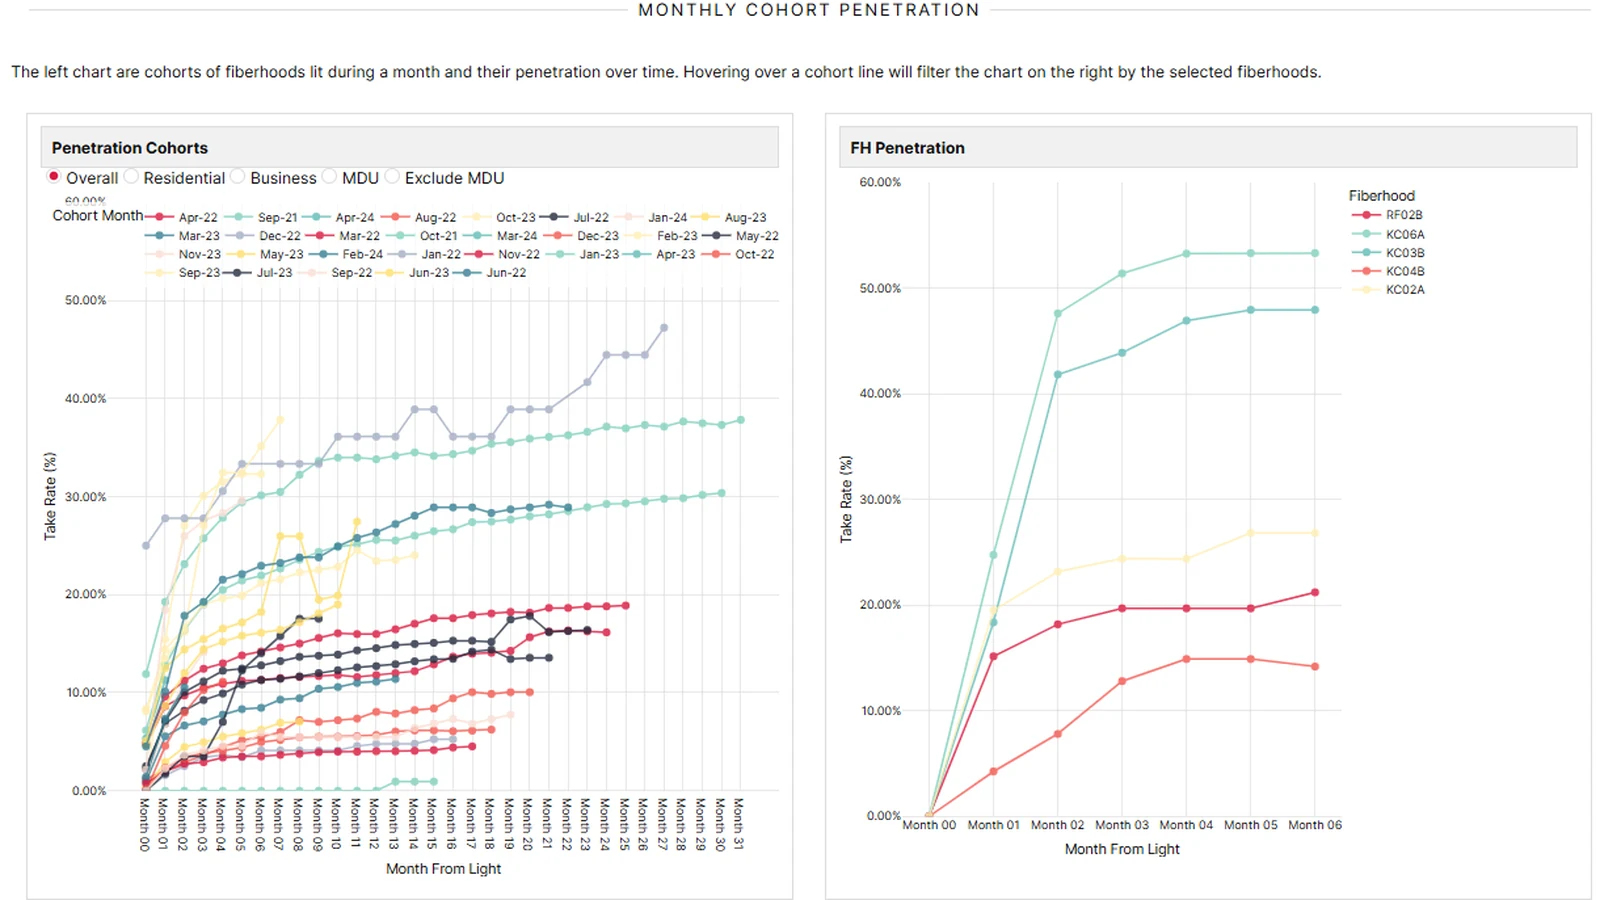
At the far end of the same build, comparing penetration across markets sounds simple until you try it. A fiberhood lit in October 2021 and one lit in April 2024 are not comparable on a calendar. Putting them side by side is comparing a toddler to a teenager and concluding the teenager is doing well.
The fix is to measure in months from light. Group fiberhoods into cohorts by the month they were energized, then plot take rate against how long each cohort has been live. Every curve starts at zero on the same axis, and the shapes become comparable.
That makes it a time-series problem more than a reporting problem, because the shape of the curve is the answer and a snapshot of today’s take rate is not. On that axis the questions get sharper:
- Which cohorts flatten early, and what was different about how they were marketed.
- Which keep climbing past month twelve, which tells you whether a slow start is just a slow start.
- How residential, business, and MDU differ in the same footprint, since a blended number hides all three.
What We Are Building Next
Both of these still land as dashboards, which means they answer the questions we thought to anticipate. The rest queue up behind whoever can write the query.
We closed the talk on what we are doing about that: a chat interface that builds an analysis against data we have already curated, and a path from a single .csv to an interactive page in minutes. Not to replace the dashboards, but to get project managers and CSRs to their own answers.
If any of this sounds like your Monday morning spreadsheet, reach out to us! We are happy to walk through either dashboard against your own build.