
Spend Less Time in Spreadsheets
Broadband Insights integrates data across your tech stack to build a comprehensive view of operational metrics and KPIs, so your team can make the right decisions on your fiber deployment.
Request a Demo01
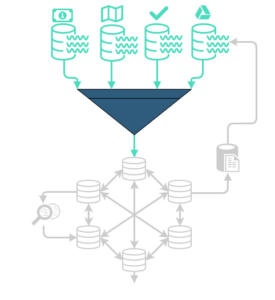
Data Integration
Aggregate data across your broadband tech stack and create key metrics.
02
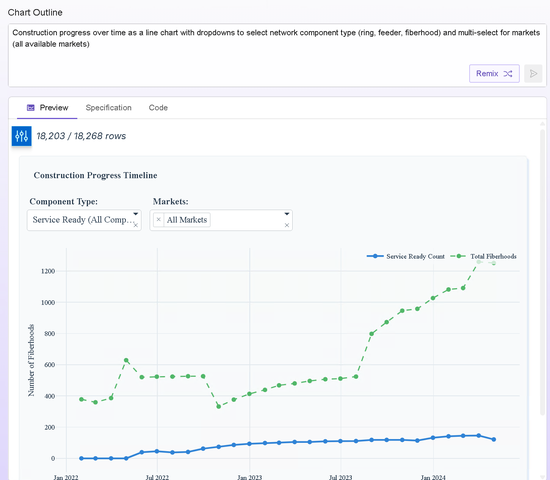
Dashboards
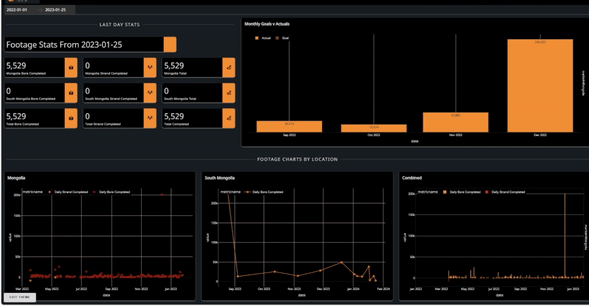
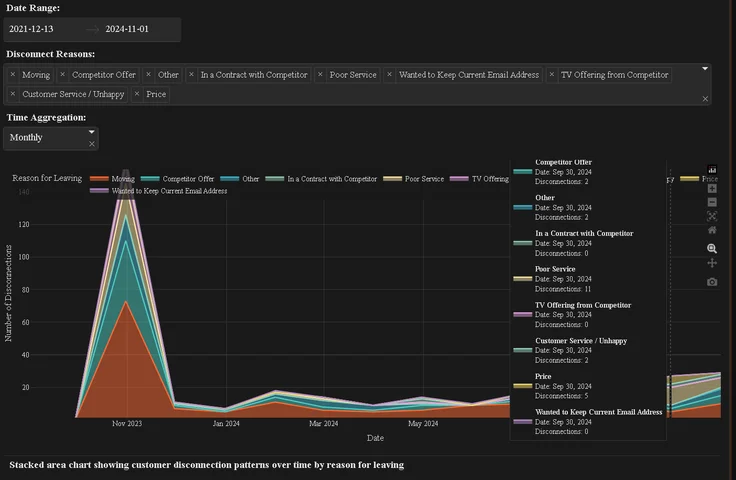
Customizable dashboards to visualize metrics, KPIs, trends, and statistics for your network deployment. Just ask in plain English — "show me customer churn by region" or "graph fiber installs against trouble tickets" — and get a shareable chart in minutes, no analyst required.
03
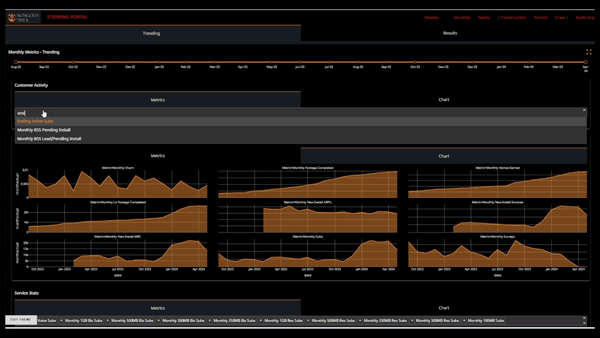
Reporting
Scheduled PDF reports delivered to your inbox, with historical archives via Snapshot Engine.
04
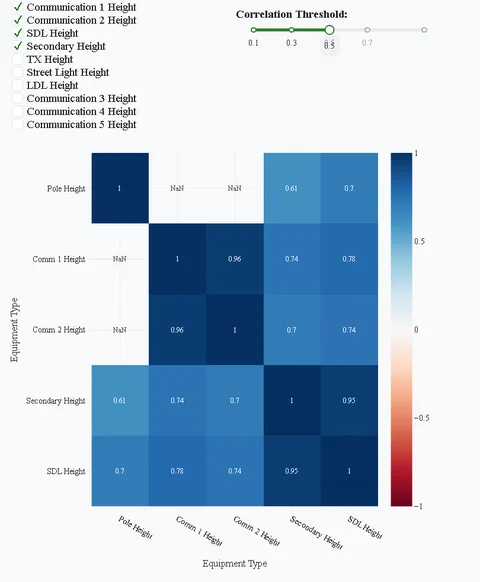
Analytics Platform
Data science tools for in-depth analysis of your FTTH, fiber, and network projects.
05
Data QA
Automated monitoring and notifications on service health, API issues, and missing data.
06
Data Analysis
Drill down to investigate deployment progress and opportunities.
How your data moves
Collection — We collect and organize your key operational data on customer activity, construction progress, and financials.
Refinement — We refine it with a uniform schema to snapshot KPIs and warehouse key entities.
Redundancy — We back it up and store it in a secure location with multiple failovers.
Output — We create custom metrics and dashboards that tell the story of your network build.