Upload your data. Ask a question in plain English. Get charts you can share in minutes not days. No code, no analysts, no waiting.
Start Exploring with Rapid Dash:
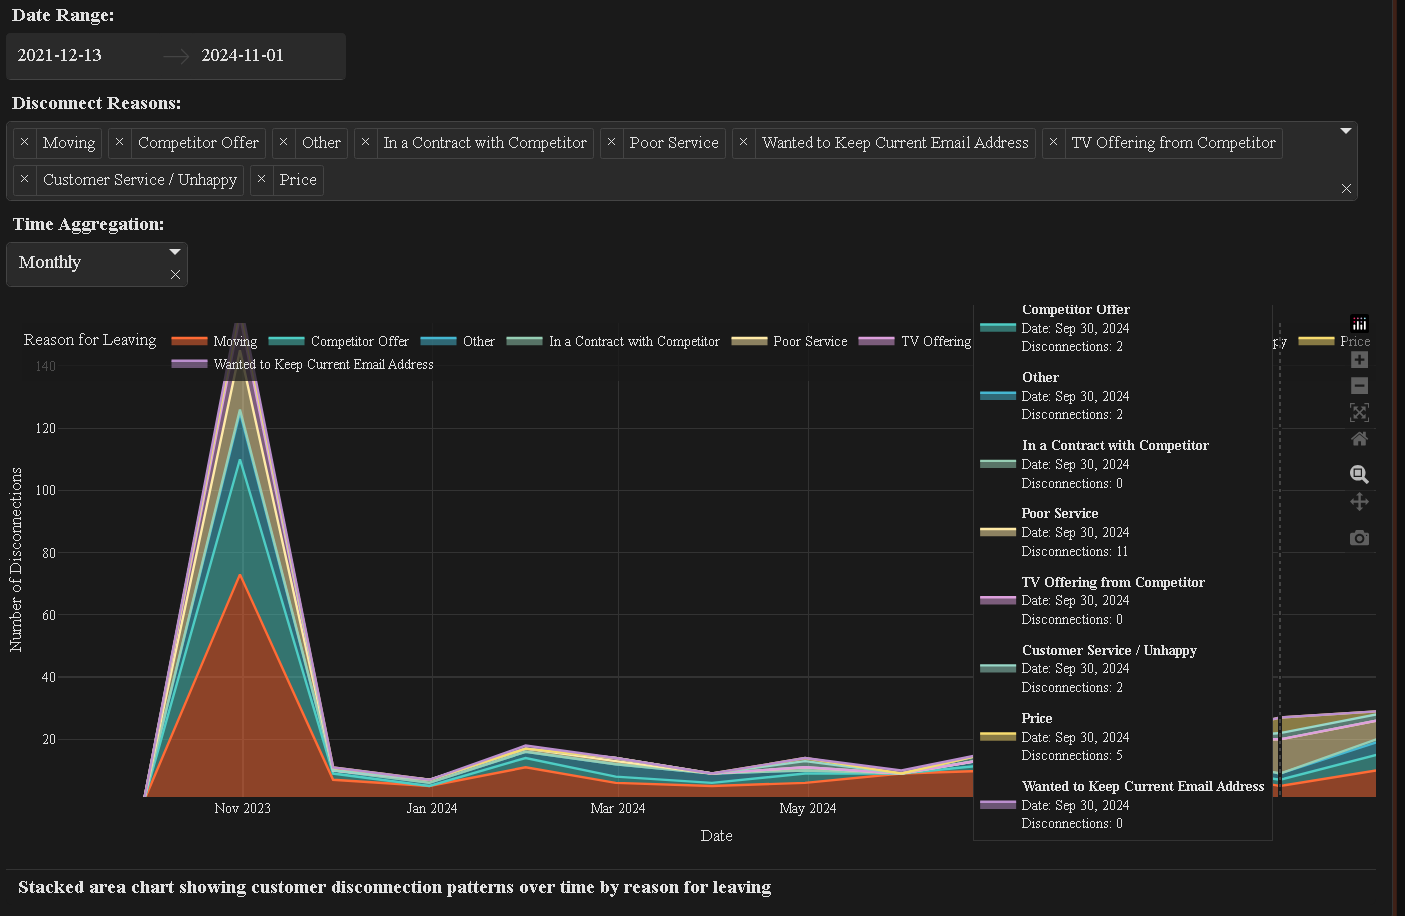
"Show me a dashboard of customer churn by region"
"Generate a bar chart on homes passed and cost"
"Analyze the most popular data packages"
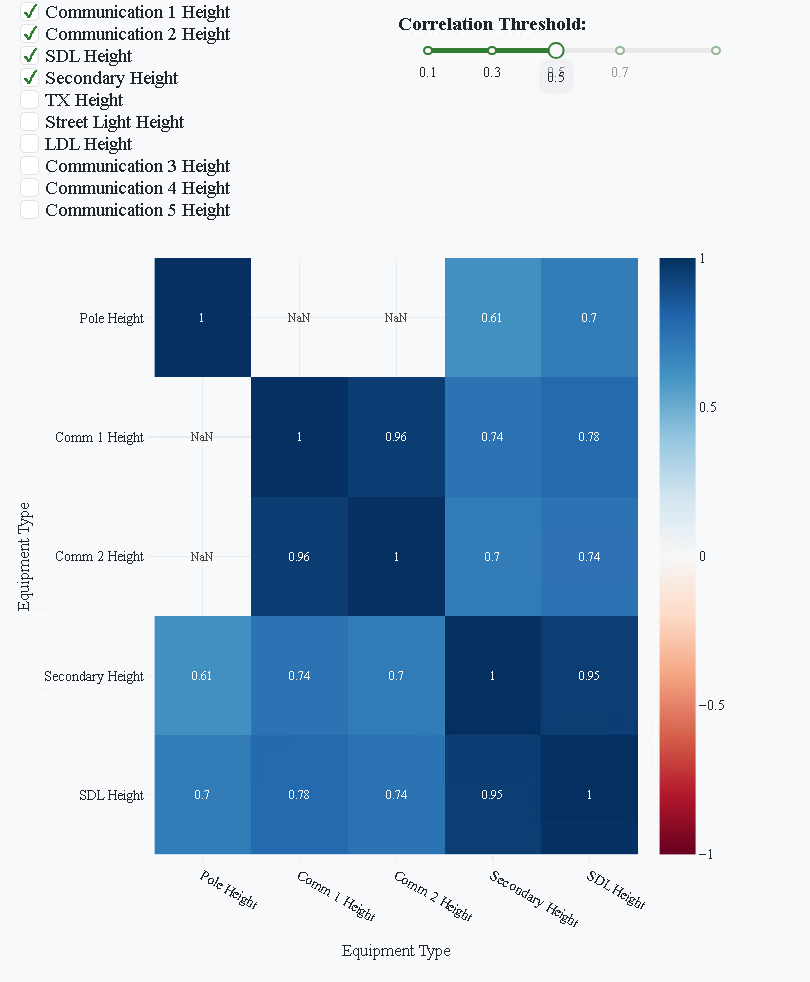
"Graph the relationship between fiber installs and trouble tickets"
10 Day Free Trial for Signups in December
Dashboards from .csvs in minutes
No code needed - just ask in plain English
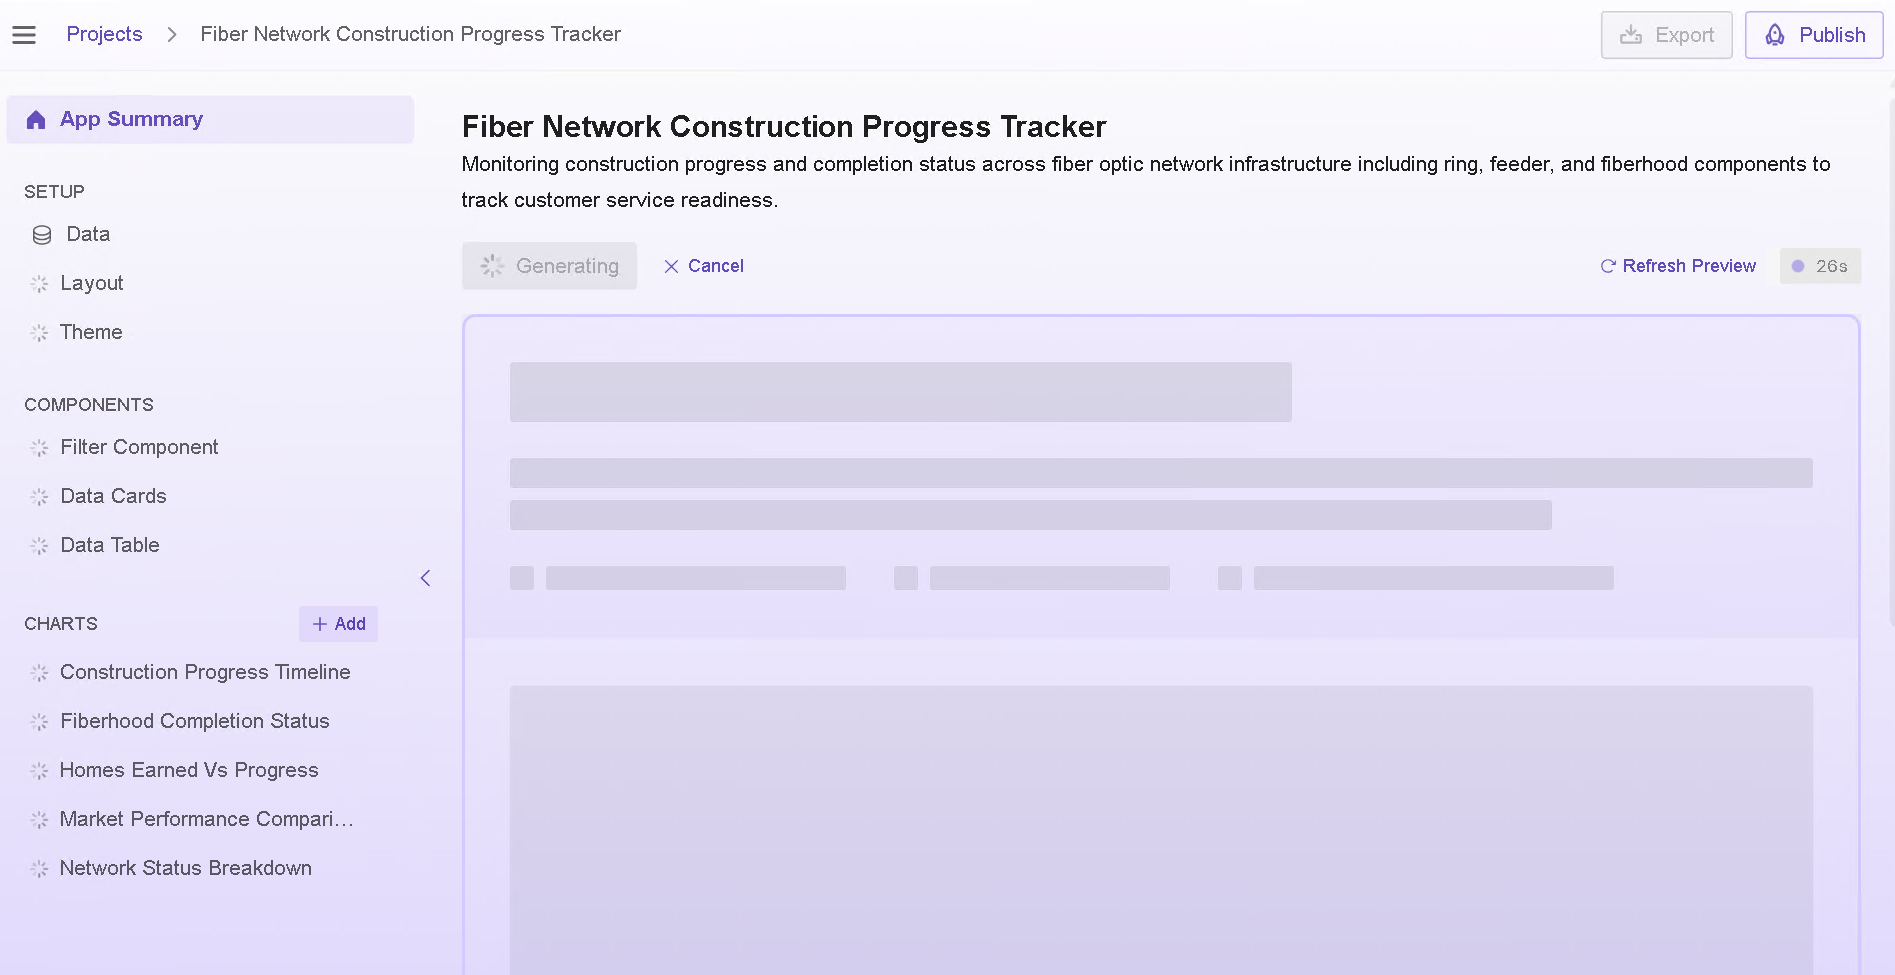
Publish and share online with one click
Designed for non-technical users
Stop Waiting on Dashboards
Explore your broadband data without hiring an analyst
Rapid Dash removes the complexity from data analysis. Anyone on your team can ask a question in natural language and get a clean, editable chart — ready to explore or share. No need to learn BI tools or wait for analyst bandwidth. Just plug in your file and go.
From install delays to churn patterns - explore it all
Rapid Dash was designed specifically for broadband and infrastructure teams. Whether you’re tracking field install backlogs, network performance, or customer requests, you can drop in your raw data and quickly uncover trends, gaps, and opportunities — without needing a dedicated data team.