

























Broadband Insights

Five broadband KPIs every week, from the systems you already run

$500 a month, five metrics, delivered weekly. Take one of the three standard sets below or choose your own five from a menu of fifty.

We build the pipeline into whatever holds your data and agree each definition once. The number that arrives in week fifty is calculated the same way as the one in week one.

Tell us which five you want and what systems you run, and we will come back with the first week.

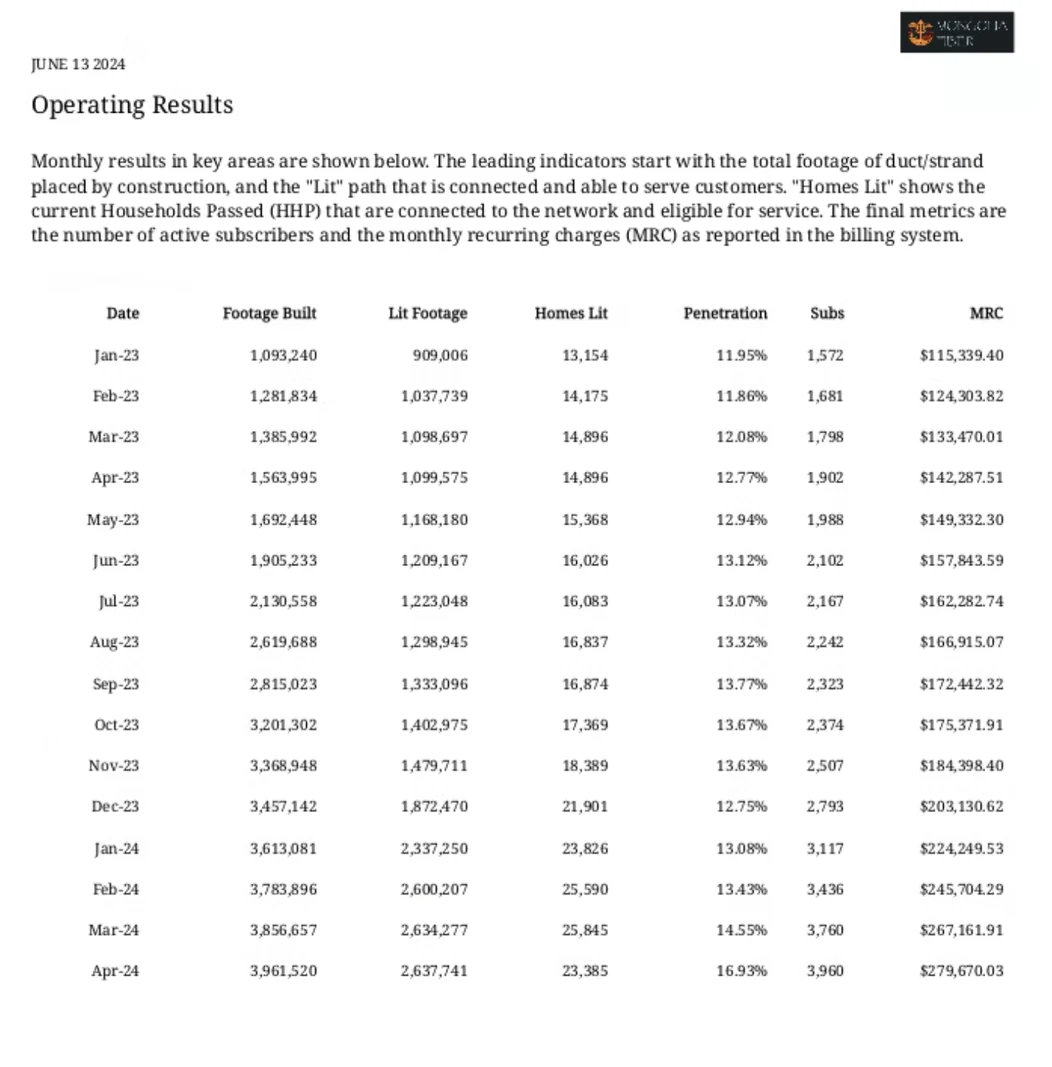
An operating results page listing sixteen consecutive months against footage built, lit footage, homes lit, penetration, subscribers and monthly recurring charges, above a note explaining that the leading indicators start with duct and strand placed and end with active subscribers and MRC from the billing system

OSS and BSS

  • Vision, a Fibersmith software solution
  • Sonar
  • COS Systems
  • Gaiia
  • Camvio
  • NISC
  • eLation by Innovative Systems
  • GLDS
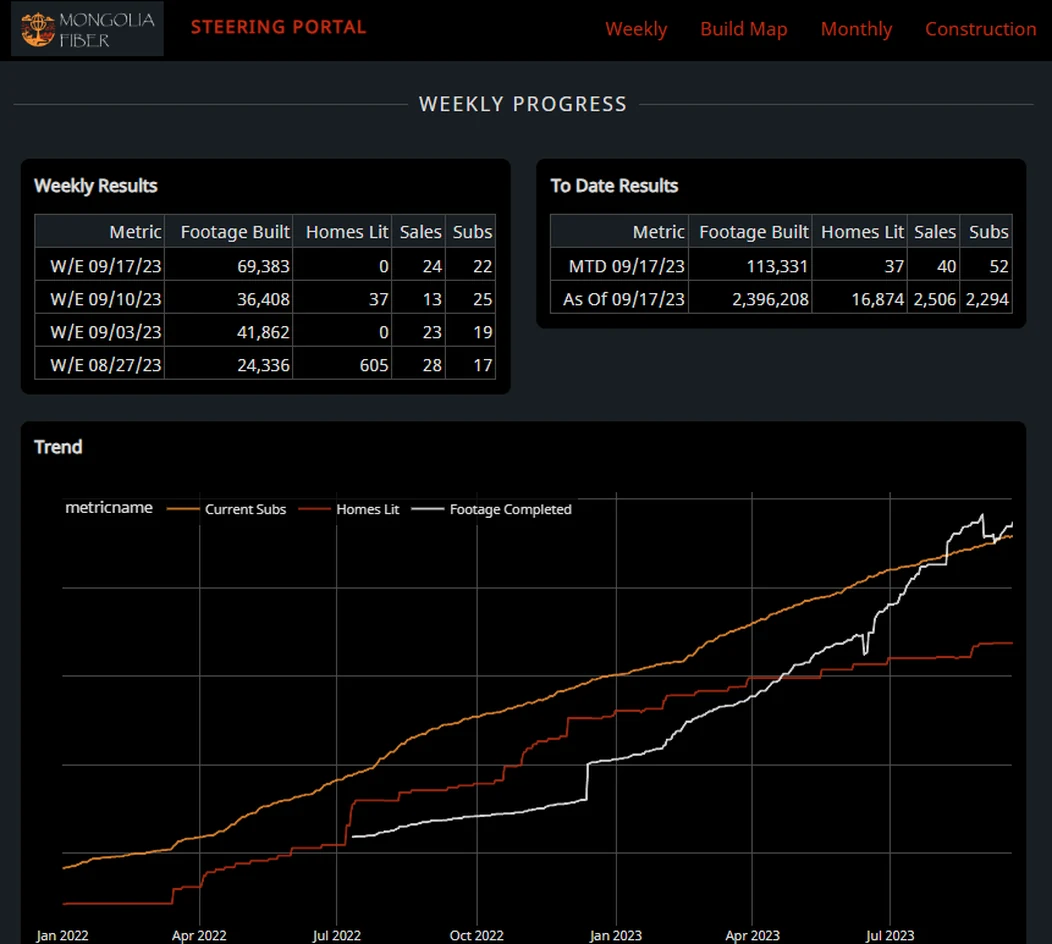
A weekly progress view listing the last four week-ending dates against footage built, homes lit, sales and subscribers, beside a to-date panel and a two-year trend of subscribers, homes lit and footage completed

Three standard sets, or your own five

Most operators take a set and adjust it. Any metric here swaps for any other on the menu below, and the five you start with are not the five you are stuck with.

Board

  • Total Subscribers
  • Net Adds
  • Take Rate
  • ARPU
  • MRC

Build

  • Homes Passed
  • Footage Completed
  • Homes Per Mile
  • Aerial/Underground Ratio
  • Homes In Progress

Sales

  • Fiber Sales
  • Scheduled Installs
  • Total Subscribers
  • Take Rate
  • Average Time To Activate

The Board set is built on what public operators report, so every number in it can be put in front of a lender or an investor on a definition they already recognise.
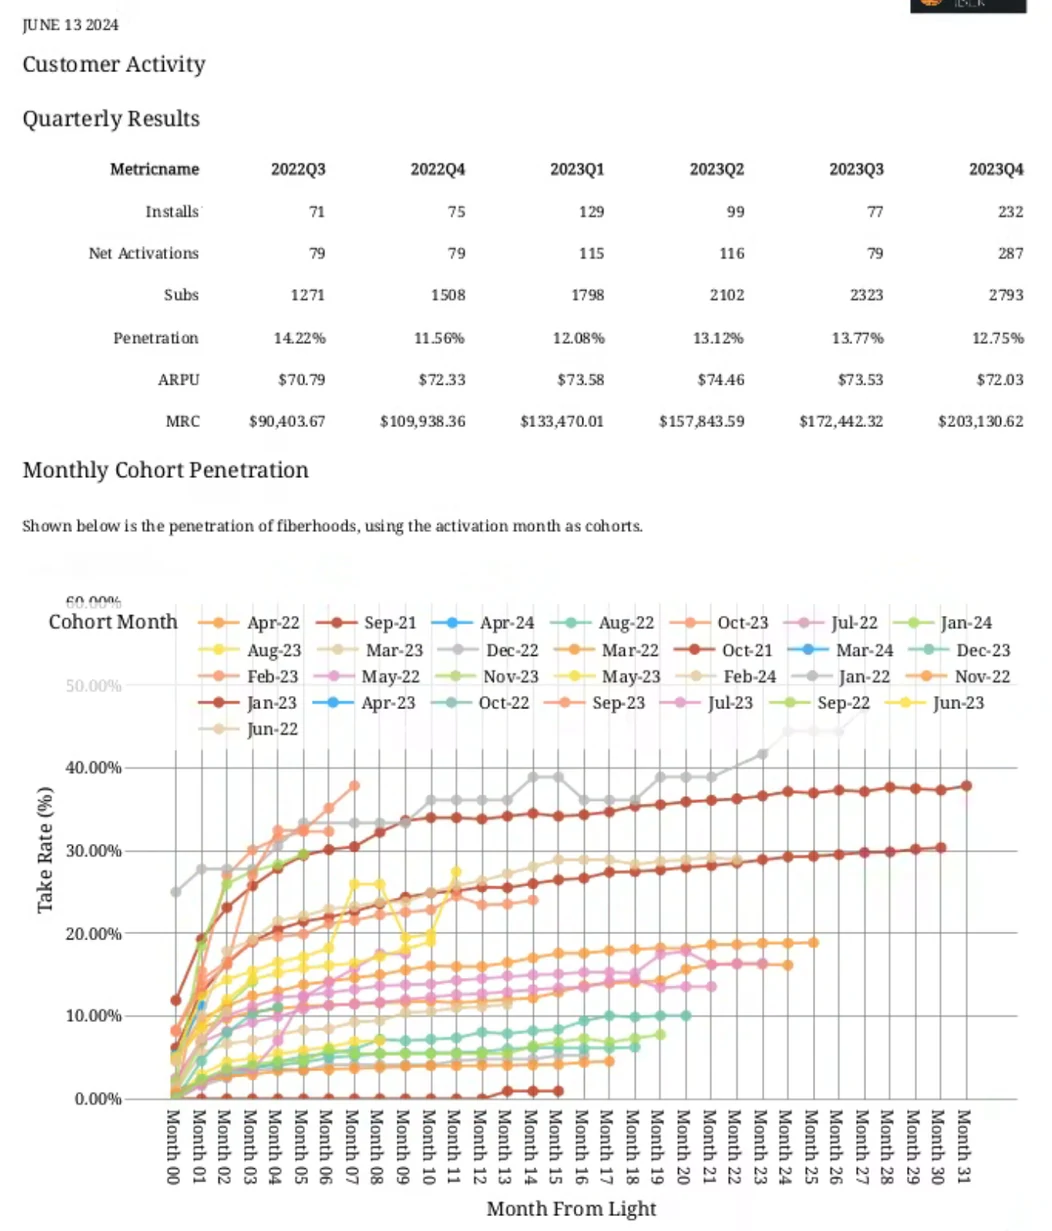
A customer activity page with a quarterly table separating installs, net activations and subscribers as three different counts, alongside penetration, ARPU and MRC, above a chart of take rate by activation-month cohort plotted against months from light

The definition is the work, not the chart

Ask four people at a broadband operator how many subscribers there are and you can get four answers. Public operators split on it too. Some count customer relationships, one household counted once. Others count revenue generating units, one per service line. None of them add up to each other.

We settle it once, in writing, then build to it. That is most of what you are paying for.

ARPU is the sharpest case. At least five different constructs share the name across the operators we catalogued, which is why the Board set carries MRC beside it.

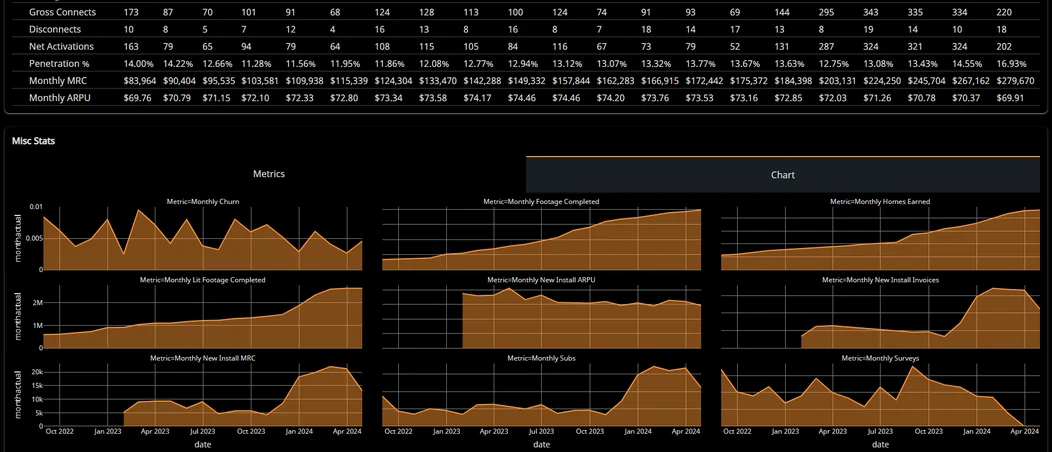
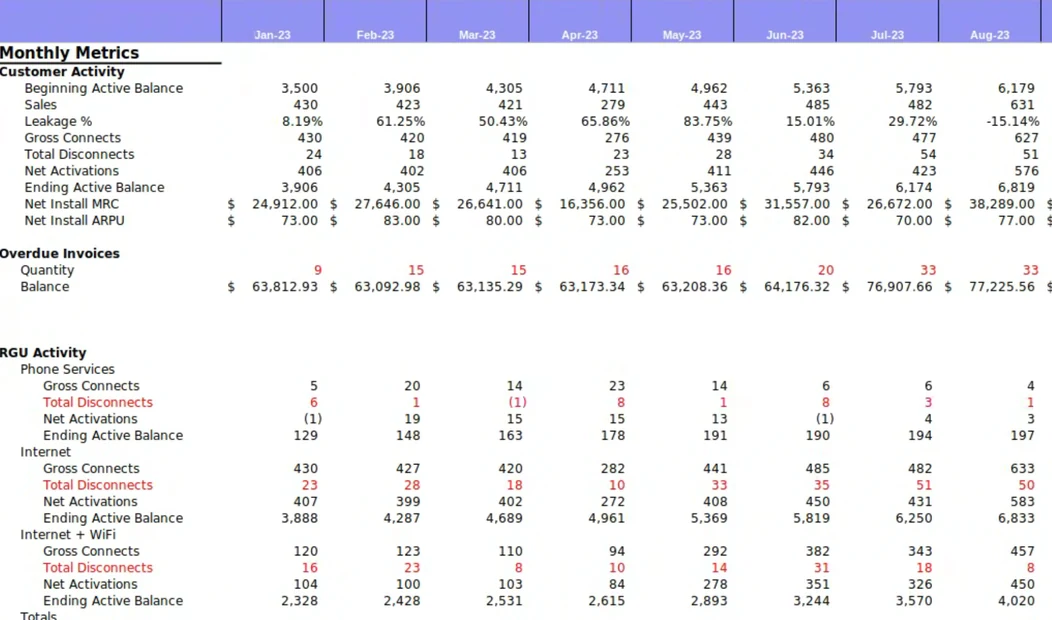
A monthly metrics spreadsheet with customer activity and RGU rollups broken out by phone, internet and internet with wifi, showing gross connects, disconnects, net activations and ending balances month by month

A pipeline, not an export you run yourself

Your data sits in a billing system, a construction platform, a fiber management system, and spreadsheets a crew fills in. We build the pipeline across them and keep it running as those systems change, so a renamed field or a new market is not your problem.

That is why it is monthly. You are not buying five numbers. You are buying five numbers that keep being right.

Nine small monthly trend charts side by side, covering churn, footage completed, homes earned, lit footage, new install ARPU, invoices, MRC, subscribers and surveys

The full menu

Fifty metrics across seven groups. Choose any five, and change them whenever the build moves on to a different question. Anything here can be swapped into one of the standard sets.

Subscribers And Revenue

  • Total Subscribers
  • Net Adds
  • Subscribers By Service — fiber, coax, video, voice, wifi
  • Subscribers By Speed Tier
  • Residential, Business, Commercial And Government Split
  • ARPU
  • MRC
  • ACP Subscribers
  • Accounts In Collections
  • Deactivated Subscribers

Churn And Disconnects

  • Total Disconnects
  • Voluntary And Involuntary Disconnects
  • Disconnects By Reason — price, quality, moved out, non-payment
  • Residential And Commercial Disconnects

Sales, Installs And Activation

  • Leads
  • Fiber Sales
  • Scheduled Installs
  • Completed Installs
  • Completed Against Scheduled Rate
  • Failed Installs
  • Late And Outstanding Installs
  • On-Time Appointment Rate
  • Missed Appointments
  • Average Time To Activate
  • Surveys And Demand Aggregation
  • Survey Penetration

Construction And Build

  • Homes Passed
  • Homes Lit
  • Homes Earned
  • Homes In Progress
  • Footage Completed
  • Bore And Strand Completed
  • Aerial/Underground Ratio
  • Homes Per Mile
  • Cost Per Home Passed
  • Cost Per Subscriber
  • Drops Buried
  • Open Bury Aging
  • Forecast Against Reported — duct, fiber, strand

Network And Field Issues

  • Open And Closed Tickets
  • Past Due Tickets
  • Unassigned Tickets
  • MST Light Issues And Time To Correct
  • Cross Connect Failures

Care And Contact Centre

  • Call Volume — inbound, outbound, trouble, billing
  • Abandon Rate
  • Average Handle Time And Queue Wait

Penetration And Market

  • Take Rate
  • Lit Penetration
  • TAM — total market, in service and coming soon

Cost Per Home Passed sits on the menu but needs capital and invoice reconciliation to be worth trusting, so it is quoted separately rather than folded into the weekly five. The same is true of field verification.