Broadband Insights

Subscriber analytics that tell you why, not just how many

Almost every broadband operator reports churn as a single rate. Very few can say how much was price, how much was service quality, how much was somebody who moved house. Three problems, three different owners, averaged into one figure.

We separate them, track how the base moves between tiers, and tie every subscriber to a revenue category that reconciles to finance.

The data is already in the systems you run. Send us a month of subscriber and billing extracts and we will show you the split.

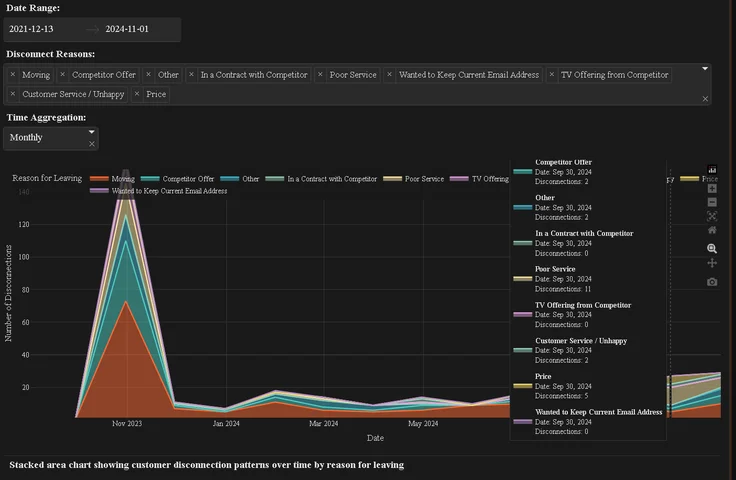
A stacked area chart of disconnections by month, split across nine stated reasons for leaving including moving, competitor offer, price, poor service and customer service

Churn is not one problem

A disconnect is first voluntary or involuntary, and the two say opposite things about the business. Involuntary churn is a credit and collections problem. Voluntary churn is a product problem, and it splits again into price, service quality, and the customer who moved out of the footprint entirely.

Reported as a single percentage, all of that collapses into a metric nobody can act on. Split by reason and trended daily, price churn arriving after a rate change looks nothing like quality churn clustered on one part of the network, and neither looks like a market where people are simply moving away.

Reason codes are tracked as both daily movement and running totals, so a spike is visible in the week it happens rather than in a quarterly review.
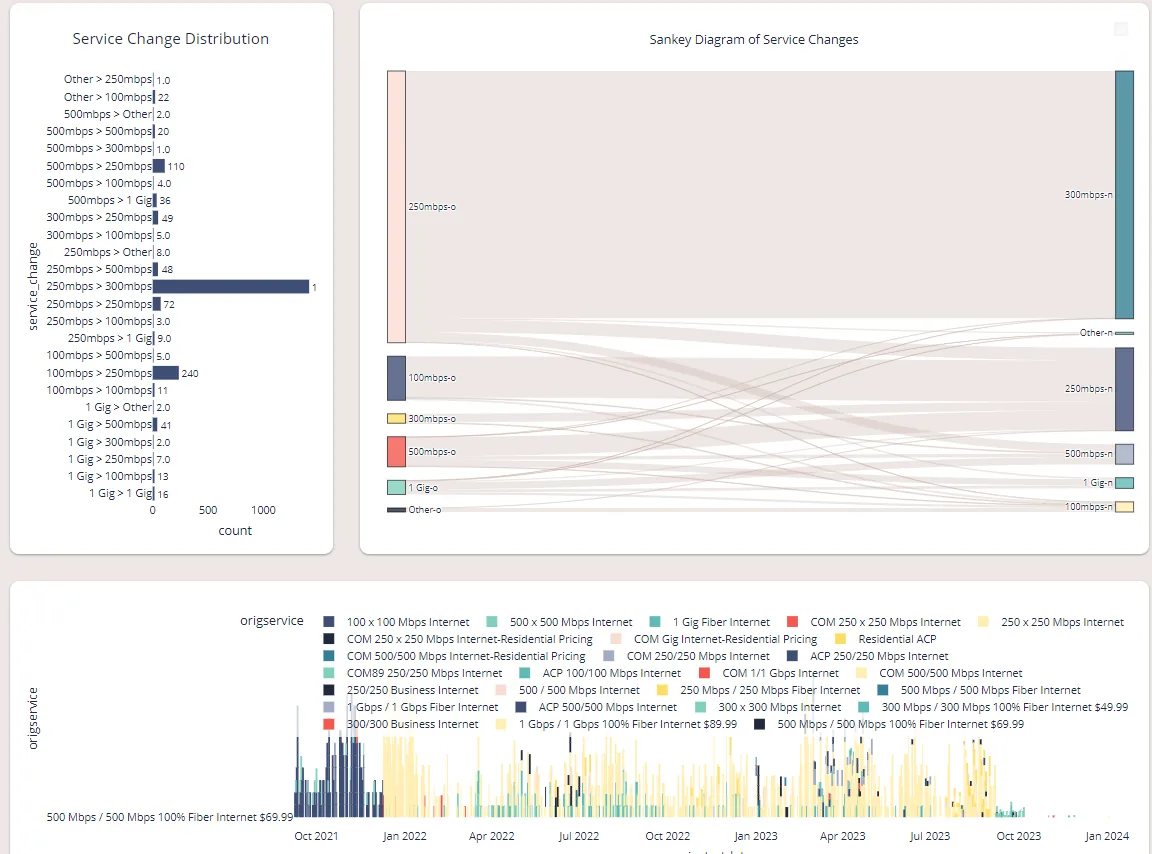
A Sankey diagram of subscribers moving between speed tiers over two years, beside a ranked distribution of every service change and a timeline of plans by original service

The subscribers who stayed are also moving

Retention is not binary. A subscriber who downgrades has partly left, and one who upgrades has told you the product is worth more than they were paying. Neither shows up in a churn rate, and both move revenue.

Mapping every service change between tiers shows which direction the base is actually travelling. The pattern usually turns out to be concentrated rather than diffuse, with a small number of tier pairs carrying most of the movement, which is what makes it worth pricing against.

An ARPU number your finance team will agree with

Counting subscribers is harder than it sounds. An invoice for equipment or a late fee is not a service subscriber, and counting it inflates the base. A subscriber taking fiber, video and voice has to land in exactly one revenue category or the buckets double count. An invoice voided after month end is still sitting in the export finance ran their numbers from.

We handle all three explicitly. Fee-only accounts are flagged and excluded from the subscriber count rather than quietly dropped, bundled subscribers are assigned a single primary category by a fixed hierarchy, and voided invoices are reconciled against an archive so the difference can be explained line by line.

Validated subscriber by subscriber against a finance team's own monthly ARPU packages across more than 30,000 subscribers. Every subscriber appearing in both systems landed in the same revenue category, and the only differences traced to invoices voided after the finance export was taken.

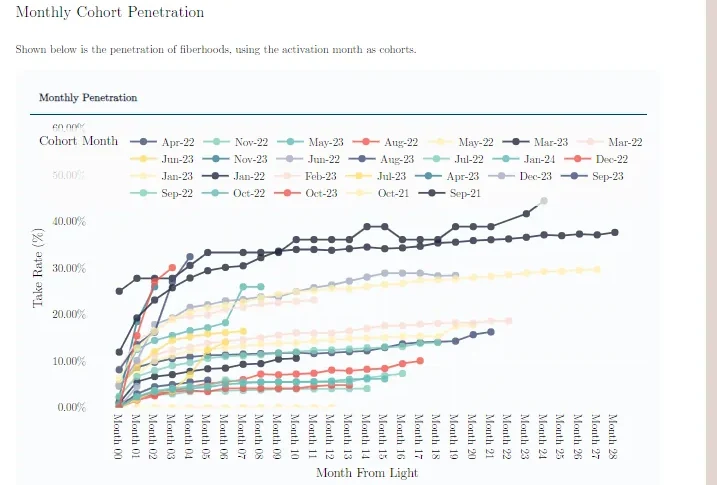
Adoption curves for more than twenty activation cohorts, each plotted by months elapsed since that area went live, showing how far and how fast each one ramps

Adoption by cohort, not one blended rate

A single penetration figure across the whole footprint averages an area lit last month against one lit three years ago. Grouping subscribers by the month their area went live, and plotting each against months elapsed rather than calendar date, makes the curves comparable.

What that shows is how quickly a new area is expected to ramp and where it flattens out, which is the difference between an area that is behind and one that is simply young.

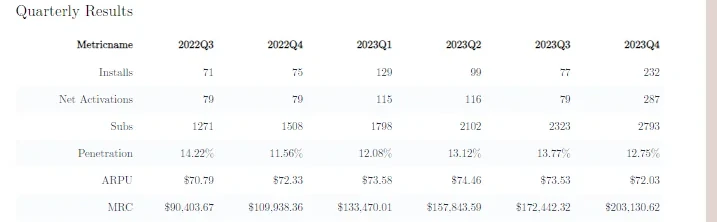
A quarterly summary table carrying installs, net activations, subscribers, penetration, ARPU and MRC across six consecutive quarters

The same definitions, quarter after quarter

Installs, net activations, subscribers, penetration, ARPU and MRC are six different questions, and they are routinely confused for one another. An install is not an activation, an activation is not a net add, and none of them is the subscriber count.

Most operators can produce any one of these on request. Far fewer can produce all six on the same basis two years apart, because the definition quietly moved the last time somebody rebuilt the report. We pin the definitions once and recalculate history against them, so a trend line means what it appears to mean.