Data Approach
Since 2023, Broadband Insights (a subsidiary of Staged Systems, LLC) have gathered, organized and aggregated fiber network “Steering” data. By capturing information from multiple business units across the tech stack and consolidating it into a single location, we provide the infrastructure and foundation to support analytics for both small and large scale fiber network builds. Data can be leveraged by department heads, executives, the board, or any other group to make informed decisions, track metrics and “steer” the company in the best possible direction.
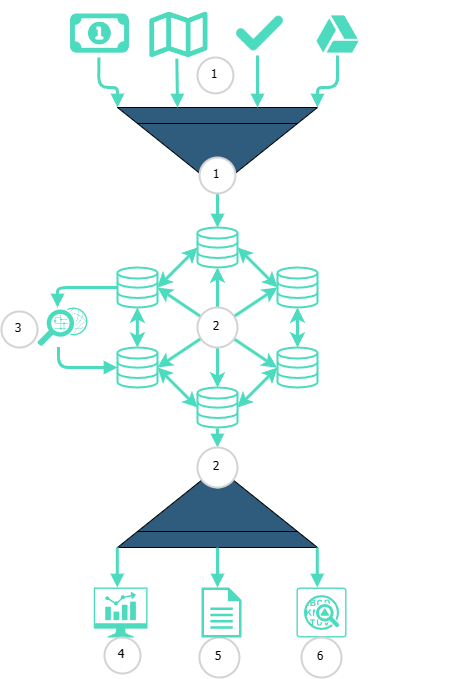
Broadband Insights Has Recognized 6 Primary Data Areas In Fiber Network Builds And Continuous Operations
Data Areas And Flow
![]() Data Capture
Data Capture
![]() Data Hosting
Data Hosting
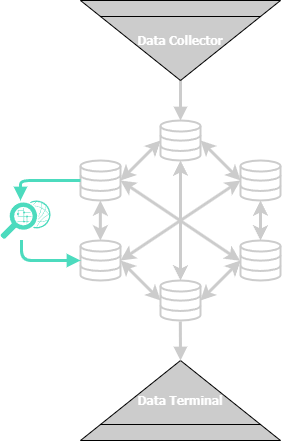
![]() Integrity Utilities
Integrity Utilities
![]() Analytics Platform
Analytics Platform
![]() Static Reporting
Static Reporting
![]() Analysis
Analysis

Data Capture
Most of the critical business data resides in best-in-class third party systems which by their nature is siloed and utilizes proprietary data models. Our “Data Collector” recurringly extracts data with the use of APIs and other capture mechanisms. Information from these sources (e.g. “wells”) is brought together, aggregated, and snapshotted. As part of the aggregation we create specialty data tables for key entities such as customers, fiberhoods, metrics, and home passings that can be used for analysis.
Data is collected, processed and aggregated daily, with more in-depth capturing being done on the first day of the month for a complete snapshot of work completed in the prior month.

Planning
- Surveys
- Cost To Build
- Estimated Penetration
- Total Addressable Market
Engineering & Construction
- Footage Built
- Planned HHP
- Cost Per Foot
- Engineering & GIS Data
Customer
- Sales
- Churn
- Installs
- Take Rate
Financial
- ARPU & MRC
- Invoices
- Service Mix
- Cost Per HHP
Aggregation
Earned Home Calculator
To track work-in-progress (WIP) we follow the project management equivalent of Earned Value Management by associating work completed to “Earned Homes”. This utilizes a proprietary model that weights construction and engineering activity, network ring/feeder/distribution architecture and other network factors.
Fiberhood Aggregator
Key data points such as subscribers, surveys, revenue, penetration and construction progress are broken down by the fiberhood which can be analyzed geographically, cohorted against time, or compared against any other dataset.
Metric Engine
By understanding the key metrics to track and analyze, we created the data points needed for Key Performance Indicators (KPIs) and perform daily snapshots for each metric so they can be tracked. Monthly targets can be set and compared against the actuals.
Service Calculator
To better understand Revenue Generating Units (RGUs) we calculate current and historical customer service data. This way we are able to see the best/least performing services as well as review trends for upgrades and downgrades.
Customer Creator
Our customer creator tool builds a dataset that aggregates survey, subscriber, and geographic information to capture past, present, and future customers.
Data Hosting
We host a robust database and handle all the services and backend requirements necessary to keep the data and applications online. Replication, backups, encryption and security certificates along with other infrastructure necessary are maintained to keep services secure and highly available.

Refinery (Data Warehouse)

Our “Refinery” is a massively scalable repository for data including daily snapshots. Portions of the warehouse will be optimized for the mass collection and storage of time series data for later retrieval and analysis. Goal is to be horizontally scalable so that as your data grows – the infrastructure can grow with it with no major architectural changes or high risk migrations.
Terminal (Analysis DB)

A secondary “Terminal” has been established that is optimized for speed and a high volume of concurrent queries and other retrieval tasks. This will be the endpoint used for any reporting, queries, analysis and any applications. Connections are pooled and load balanced to give the best possible performance while still enabling large volume of end users. Common queries can be cached or stored as procedures for quick refreshes.
Integrity Utilities
Our team has developed several tools to flag errors in reporting. These utilities assist with identifying errors, sending notifications, and creating the source data to research root issues. This includes a series of high level “sanity checks” as well as detailed table comparison for harder to identify issues.

Integrity Checker
This tool runs a series of checks for “data integrity” errors on all tables, for example primary/foreign key matches between related tables, null values, etc.
Circuit Breaker
Prior to any scheduled reports being issued a “sanity check” is run against major metrics and potential errors are classified and flagged. A notification will be sent out with any errors and their severity prior to reports being issued so the reports can be delayed and corrected.
Error Reports
The results from the “Integrity Checker” are logged to a dataset with descriptions of all issues. These can be routed to the proper parties responsible for resolution.
Data Health Site
The team is currently building a front-facing application to easily view high level error/quality summaries as well as the ability to drill into details at the record level.
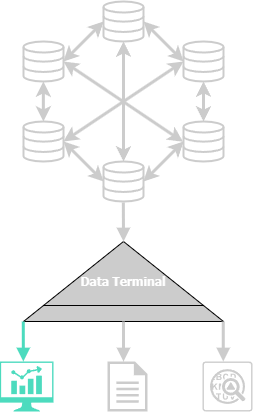
Analytics Platform
We have built a custom BI platform to explore telecom data that has been specifically configured for fiber network construction needs. We will provide pre-configured pages for each major ISP department (e.g. Sales, Net Ops, Construction and Engineering, etc.) where teams can see key data without being overwhelmed, but offer the ability to explore deeper if desired.

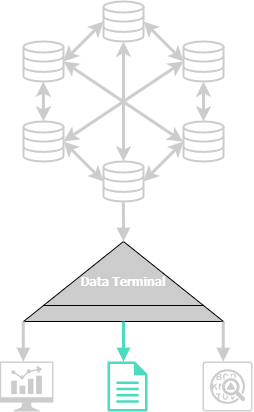
Reporting
We work with customers to fulfill their custom reporting needs. Many of these standardized reports have been built from the “Steering Data” that can be carved by both time and market. Our goal is to create templates that are interactive and filterable for independent analysis, but realize busy executives only have the time to review .pdf delivered by email.
The reports are quality checked and have a scheduled send which is based on the specified time period. Historical copies will be stored, organized, and transferred monthly. Extra QA can optionally be provided via recurring in-house huddles with QA team prior to deliverable handoffs with huddle checklist included as a handoff item.

Analysis
Currently we perform analysis on request and can generate .csvs, spreadsheets, or friendly charts and graphs customized per the individual requirements. If supplemental data is required outside of what is stored in the “Steering Database”, our team has experience in many popular telecom systems to retrieve extra data or work with the right resource who can provide it. We understand that some businesses have their own analytical staff but we can either support, augment, or act as your analysis team. We also have the ability to offer on-call service with SLAs on certain levels of queries.

