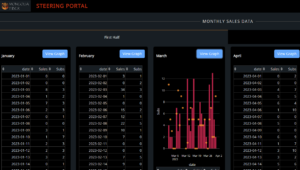
Our analytics platform is a great power-up for sales and marketing teams and we just finished updating a few dashboards for our demo and put together an overview video with some examples of take rate and RGU reporting.
In the broadband industry, data is abundant but often inaccessible to the people who need it most. Sales and marketing teams rely on insights to shape strategies, improve customer engagement, and improve take rate, yet accessing this data can feel like navigating a labyrinth of proprietary systems for the non-engineers and GIS experts.
Unlocking Insights from Broadband Data: A Guide
We aim to change that.
At BBI, we unlock the potential of your broadband data by aggregating information from across your organization and presenting it in a format that’s easy to understand and use. Out platform gives your sales team insight into network plans, construction progress, surveys, customer orders and invoices, etc. so you can prioritize your outreach efforts. With data-driven insights, sales and marketing teams can make informed decisions without technical roadblocks.
The Challenge: Siloed Systems and Limited Access
Broadband providers depend on a range of systems to manage their operations:
- Survey or Demand Aggregation Platforms
OSS/BSS (Operational and Billing Support Systems)
FMS (Fiber Management Systems)
Construction and engineering trackers
Project management tools
Financial platforms
While these systems are vital, they are often siloed, making it difficult for sales and marketing teams to extract actionable insights. This reliance on technical teams for data access creates delays, hinders decision-making, and can lead to missed opportunities.
Our Approach: Aggregating and Simplifying Your Data
We aggregate data using APIs and custom scraping software from all your key systems nightly and deliver the metrics that matter most to your team. By consolidating information into one platform, we provide an integrated view of your broadband business, tailored to the needs of non-technical users.
Daily Metrics That Drive Action
Using the aggregated data, we calculate key performance indicators (KPIs) nightly. This process creates a “snapshot” of your operations, ensuring that daily metrics reflect the most up-to-date and accurate information. These snapshots allow sales and marketing teams to monitor performance trends and make timely, informed decisions without delays or data gaps. While we collect hundreds of metrics, some of the key items for sales teams include:
Scheduled Installs or Sales: Keep track of daily installs to measure performance and allocate resources efficiently.
Subscribers and Revenue-Generating Units (RGUs): Monitor the adoption of services like 1GB data plans or static IP addresses.
“Lit” Homes: Identify homes that are ready for service to focus marketing efforts where they’ll have the most impact.
Take Rate Analytics: Leverage maps and dashboards to identify areas with high or low subscription rates and plan targeted campaigns.
Churn: Track customer turnover rates to understand retention challenges and identify opportunities to improve customer loyalty.
ARPU (Average Revenue Per User): Monitor revenue trends by analyzing the average income generated per subscriber to assess profitability and strategize effectively.
Monthly Trends for Strategic Insights
Analyze month-over-month trends in subscriber growth and service adoption.
Understand regional performance to adjust long-term strategies.
Visualizing Data for Better Decisions
Interactive maps and dashboards bring your data to life. Sales and marketing teams can:
Pinpoint areas with high take rates to upsell premium services.
Identify underserved neighborhoods with low take rates and target them with custom campaigns.
Incorporate survey data to refine strategies for areas under consideration, prioritizing high-interest zones for network expansion.
These tools turn complex datasets into actionable insights, empowering your team to make informed decisions that improve revenue and customer satisfaction.
Learn More
For a quick introduction to how we unlock insights from your broadband data, check out our 2-minute video overview.
No more chasing engineers for reports or struggling to piece together information from multiple systems. Our platform streamlines the process, so you can focus on building connections with customers and growing your business.
Ready to explore the possibilities? Contact us today to learn more about how we can transform your approach to broadband data.

