Instant Analytics for ISPs - Insights From Any Export or Spreadsheet

Upload your data, get clear KPIs and dashboards in minutes — no setup, no analysts, no hassle.

  • Turns messy data into clean, visual dashboards

  • Generates essential KPIs instantly – no analysts required

  • Built-in filters and drill downs (no config needed)

  • Roll up results by market area, contractor, or project with no setup

  • Dashboards generated in seconds – no coding needed


utility pole analysis

Use Any Data Source

We make it simple. Just upload a CSV and ask for what you need – dashboards are generated instantly using AI. No coding, no setup. Clean visuals, automated reports, and the answers you need in minutes, not days

Chart from Prompt

Example Prompts

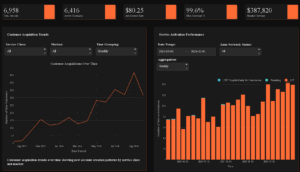
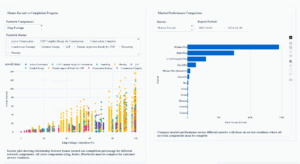
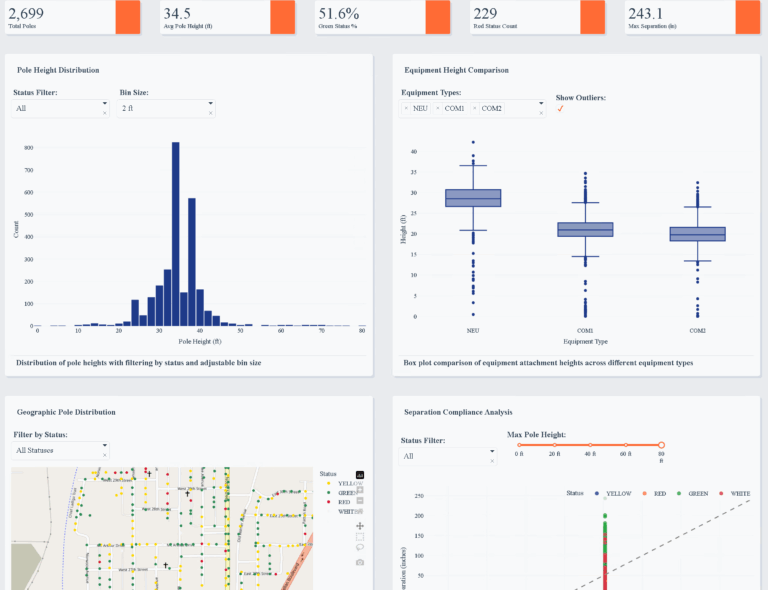
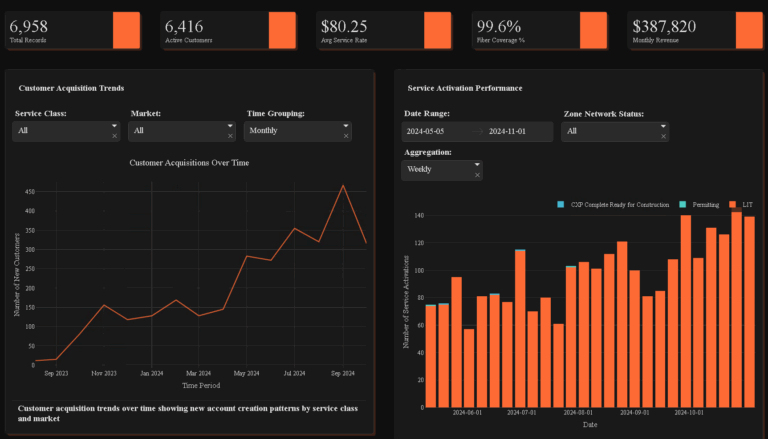
  • “Dashboard of customer churn by region over time”
  • “Graph the relationship between fiber installs and trouble tickets”
  • “Analyze the most popular data packages”
  • “Generate some charts on upgrades and downgrades”
rapid dash example

Publish Online in Minutes

Turn it into a live website you can share with anyone or protect with a password