Streamline your broadband deployment through data analytics and user friendly dashboards.
Our data analytics platform is built specifically for broadband and fiber deployments and covers planning and construction all the way through ongoing operations and billing.
Most fiber and FTTH providers want to track metrics such as footage built, homes passed, network connectivity, sales, and take rate but that won’t happen in a single platform.
Our goal is to create a single source of data for planning, construction, and operational metrics and KPIs. It has some great-looking dashboards and we can auto-send .pdf reports right to your mailbox.
Data Science for Broadband
There has been an explosion of data science tools and platforms recently, but they are all general purpose tools. Additionally they require a sophisticated staff to setup and maintain. Our platform is already configured with the key features for tracking a network build so your team can just focus on the analysis. We cover:
- Surveys and Demand Aggregation
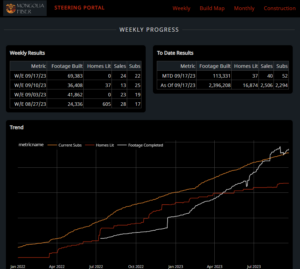
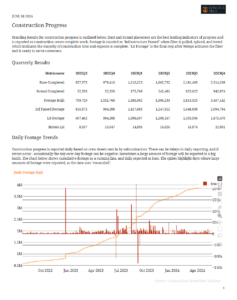
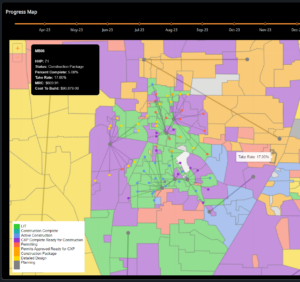
- Construction Progress
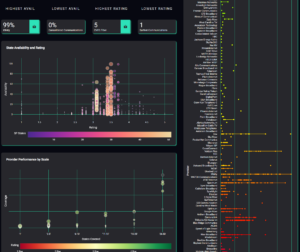
- Network Connectivity
- Take Rate and Homes Passed
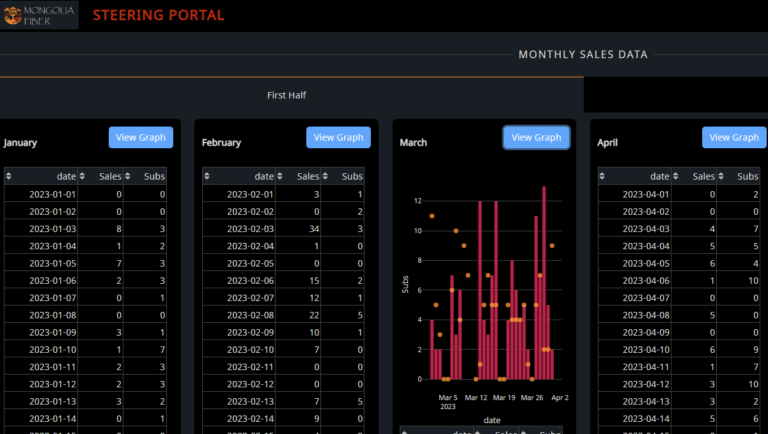
- Sales and Installs
- MRC and ARPU
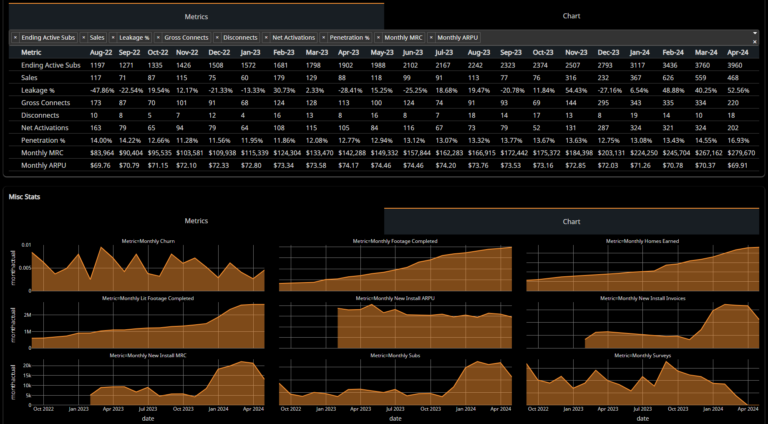
Time Series Analysis
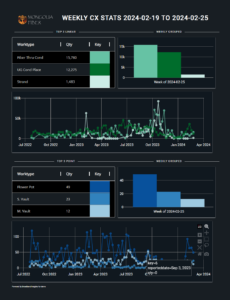
We capture daily snapshots of critical metrics and KPIs for time series analysis. Our platform makes it simple to overlay data and correlations or compare leading and lagging indicators on long build cycles. Even if your OSS/BSS and construction reporting platform have amazing data – you won’t be able to see the change over time. That’s where we come in.
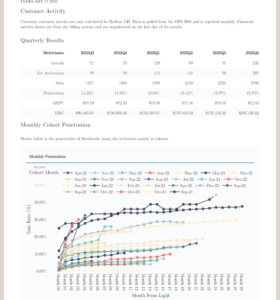
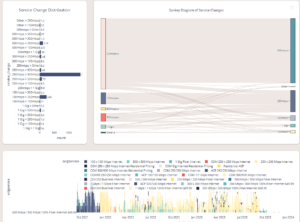
Monthly metrics are a key component and we built many features with the executive and investor in mind. We can easily show the comparison of items such as footage built, homes passed, sales, subscribers. Subscriber details and RGUs are available as well, so you can keep an eye on monthly changes such as upgrades and downgrades.
